Basic Introduction
The Comlada dashboard provides real-time access to indoor air quality data from all registered devices. The system continuously tracks key parameters including gases, particulate matter, temperature, humidity, noise, and illumination, presenting data through an intuitive interface with live graphs and status indicators.
Users can monitor multiple devices simultaneously from a single platform, view historical trends, and receive instant notifications when parameters exceed defined thresholds. The dashboard automatically updates every 1 minute, ensuring users always have current information for maintaining healthy indoor environments.
🔄 Dashboard Display Based on Device Status
The dashboard interface dynamically updates based on device connection status:
| Device Status | Dashboard Display |
|---|---|
| Online | Real-time data updates every 1 minute, all parameters visible, alerts active |
| Offline | Blank readings displayed to indicate device is offline |
Real-Time Parameter Monitoring
Air Quality Parameters
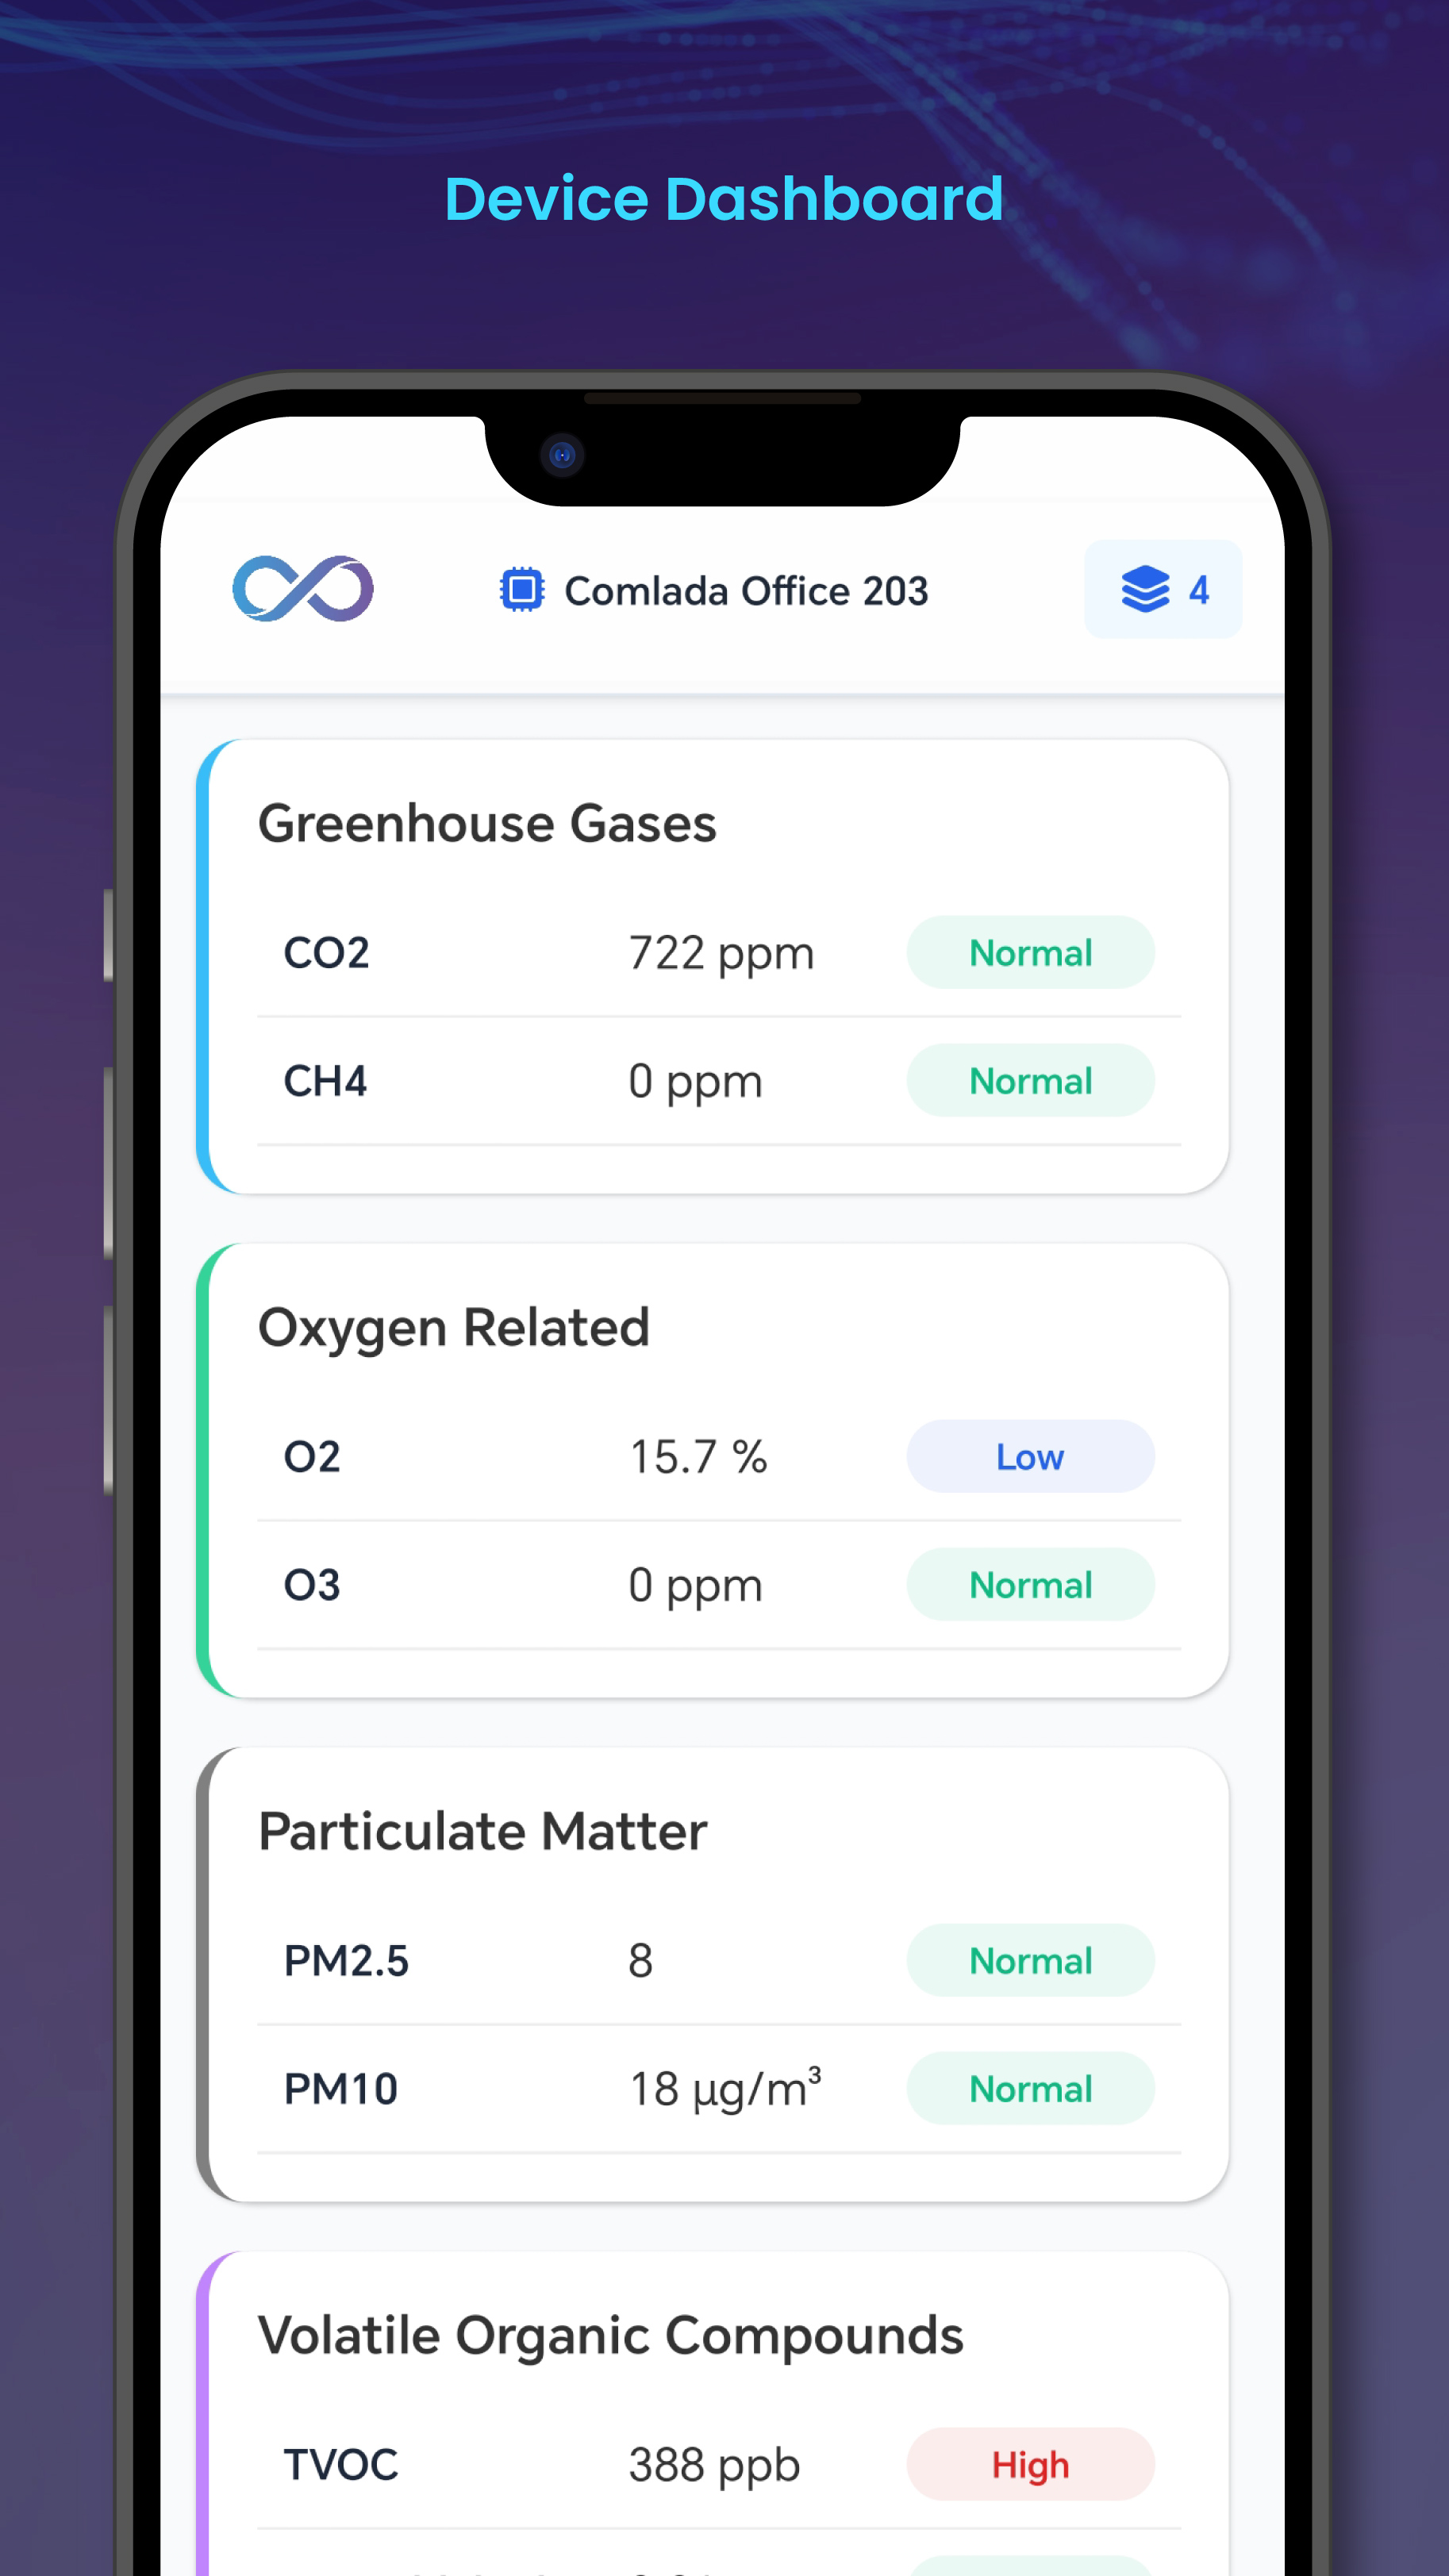
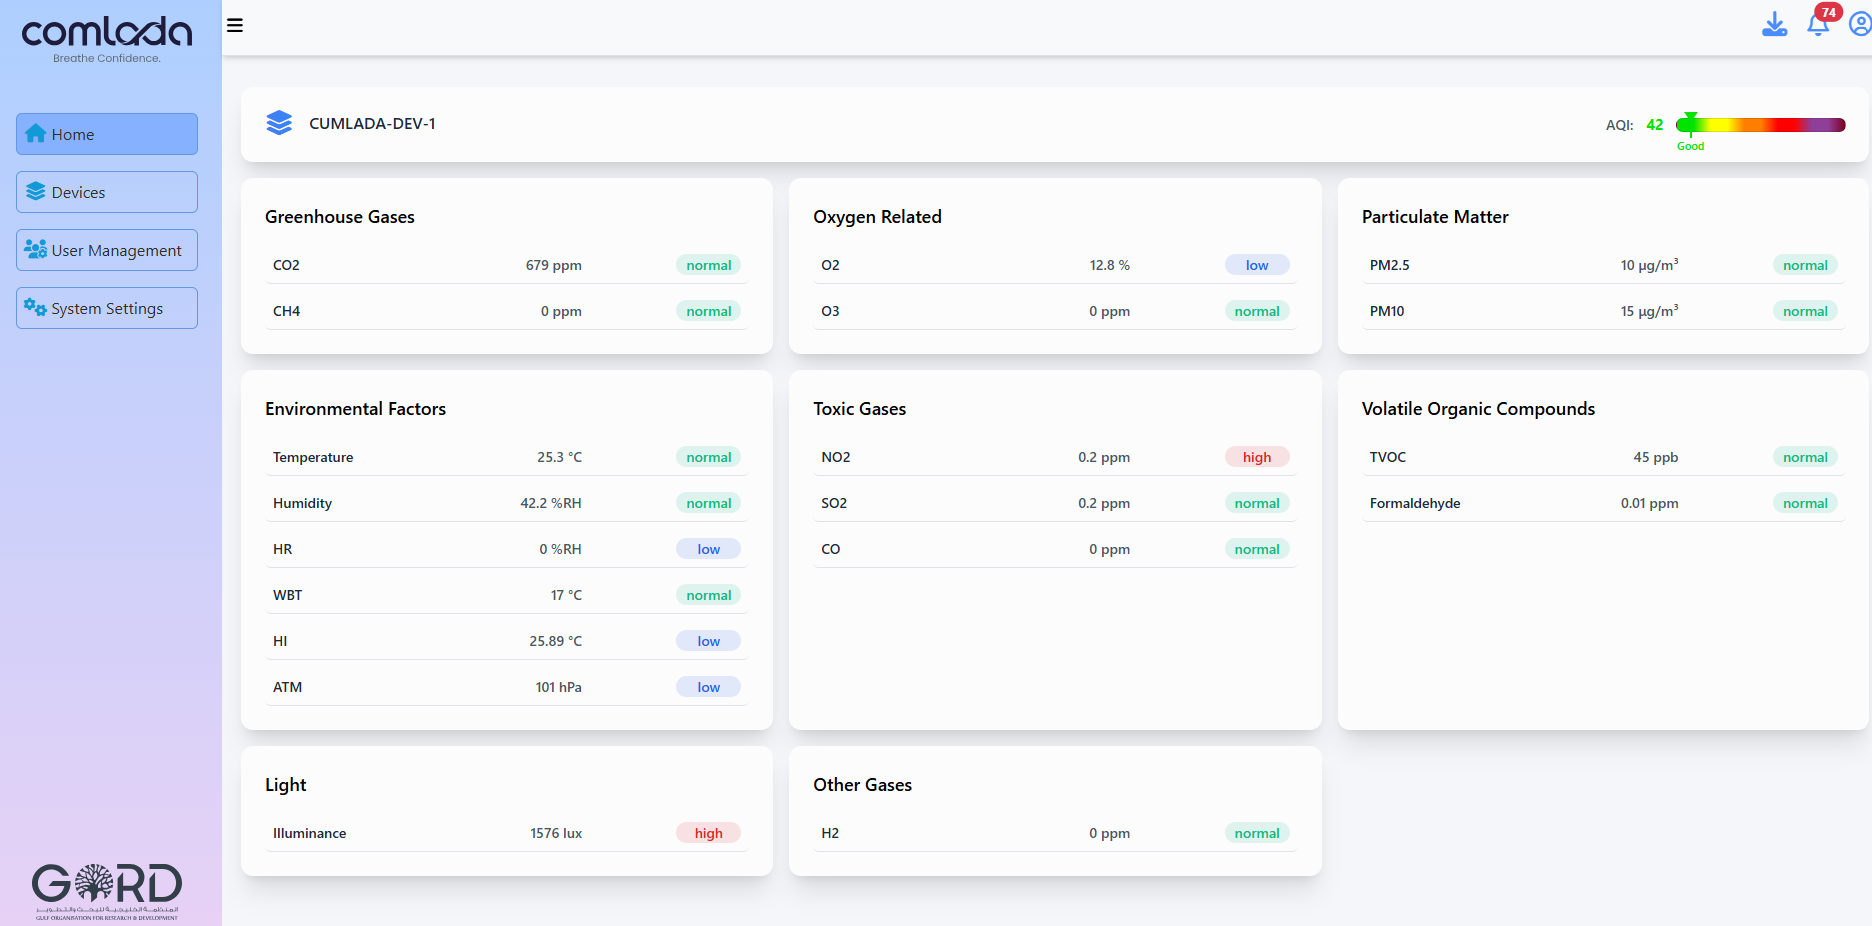
The dashboard displays live readings for all monitored air quality parameters with color-coded status indicators.
Monitored Parameters:
Gases
- CO₂ (Carbon Dioxide): Indoor air quality indicator (ppm)
- CO (Carbon Monoxide): Toxic gas detection (ppm)
- VOCs (Volatile Organic Compounds): Chemical pollutants (ppb)
- Formaldehyde: Indoor air contaminant (μg/m³)
Particulate Matter
- PM2.5: Fine particles ≤2.5 micrometers (μg/m³)
- PM10: Coarse particles ≤10 micrometers (μg/m³)
Environmental Conditions
- Temperature: Indoor air temperature (°C)
- Humidity: Relative humidity percentage (%)
Additional Parameters
- Noise Level: Sound pressure level (dB)
- Illumination: Light intensity (lux)
Note: The parameters listed above represent the core monitored indicators. Additional parameters may be available depending on your device. Contact the Comlada support team for a full list of supported parameters.
Status Indicators & Color Coding
Parameters display with color-coded indicators showing air quality status:
| Color | Status | Meaning |
|---|---|---|
| Green | Normal | Parameter within optimal range |
| Blue | Low | Below acceptable/expected range |
| Red | High | Above acceptable threshold |
Live Data Graphs
View parameter trends over time using interactive graphs with multiple time ranges.
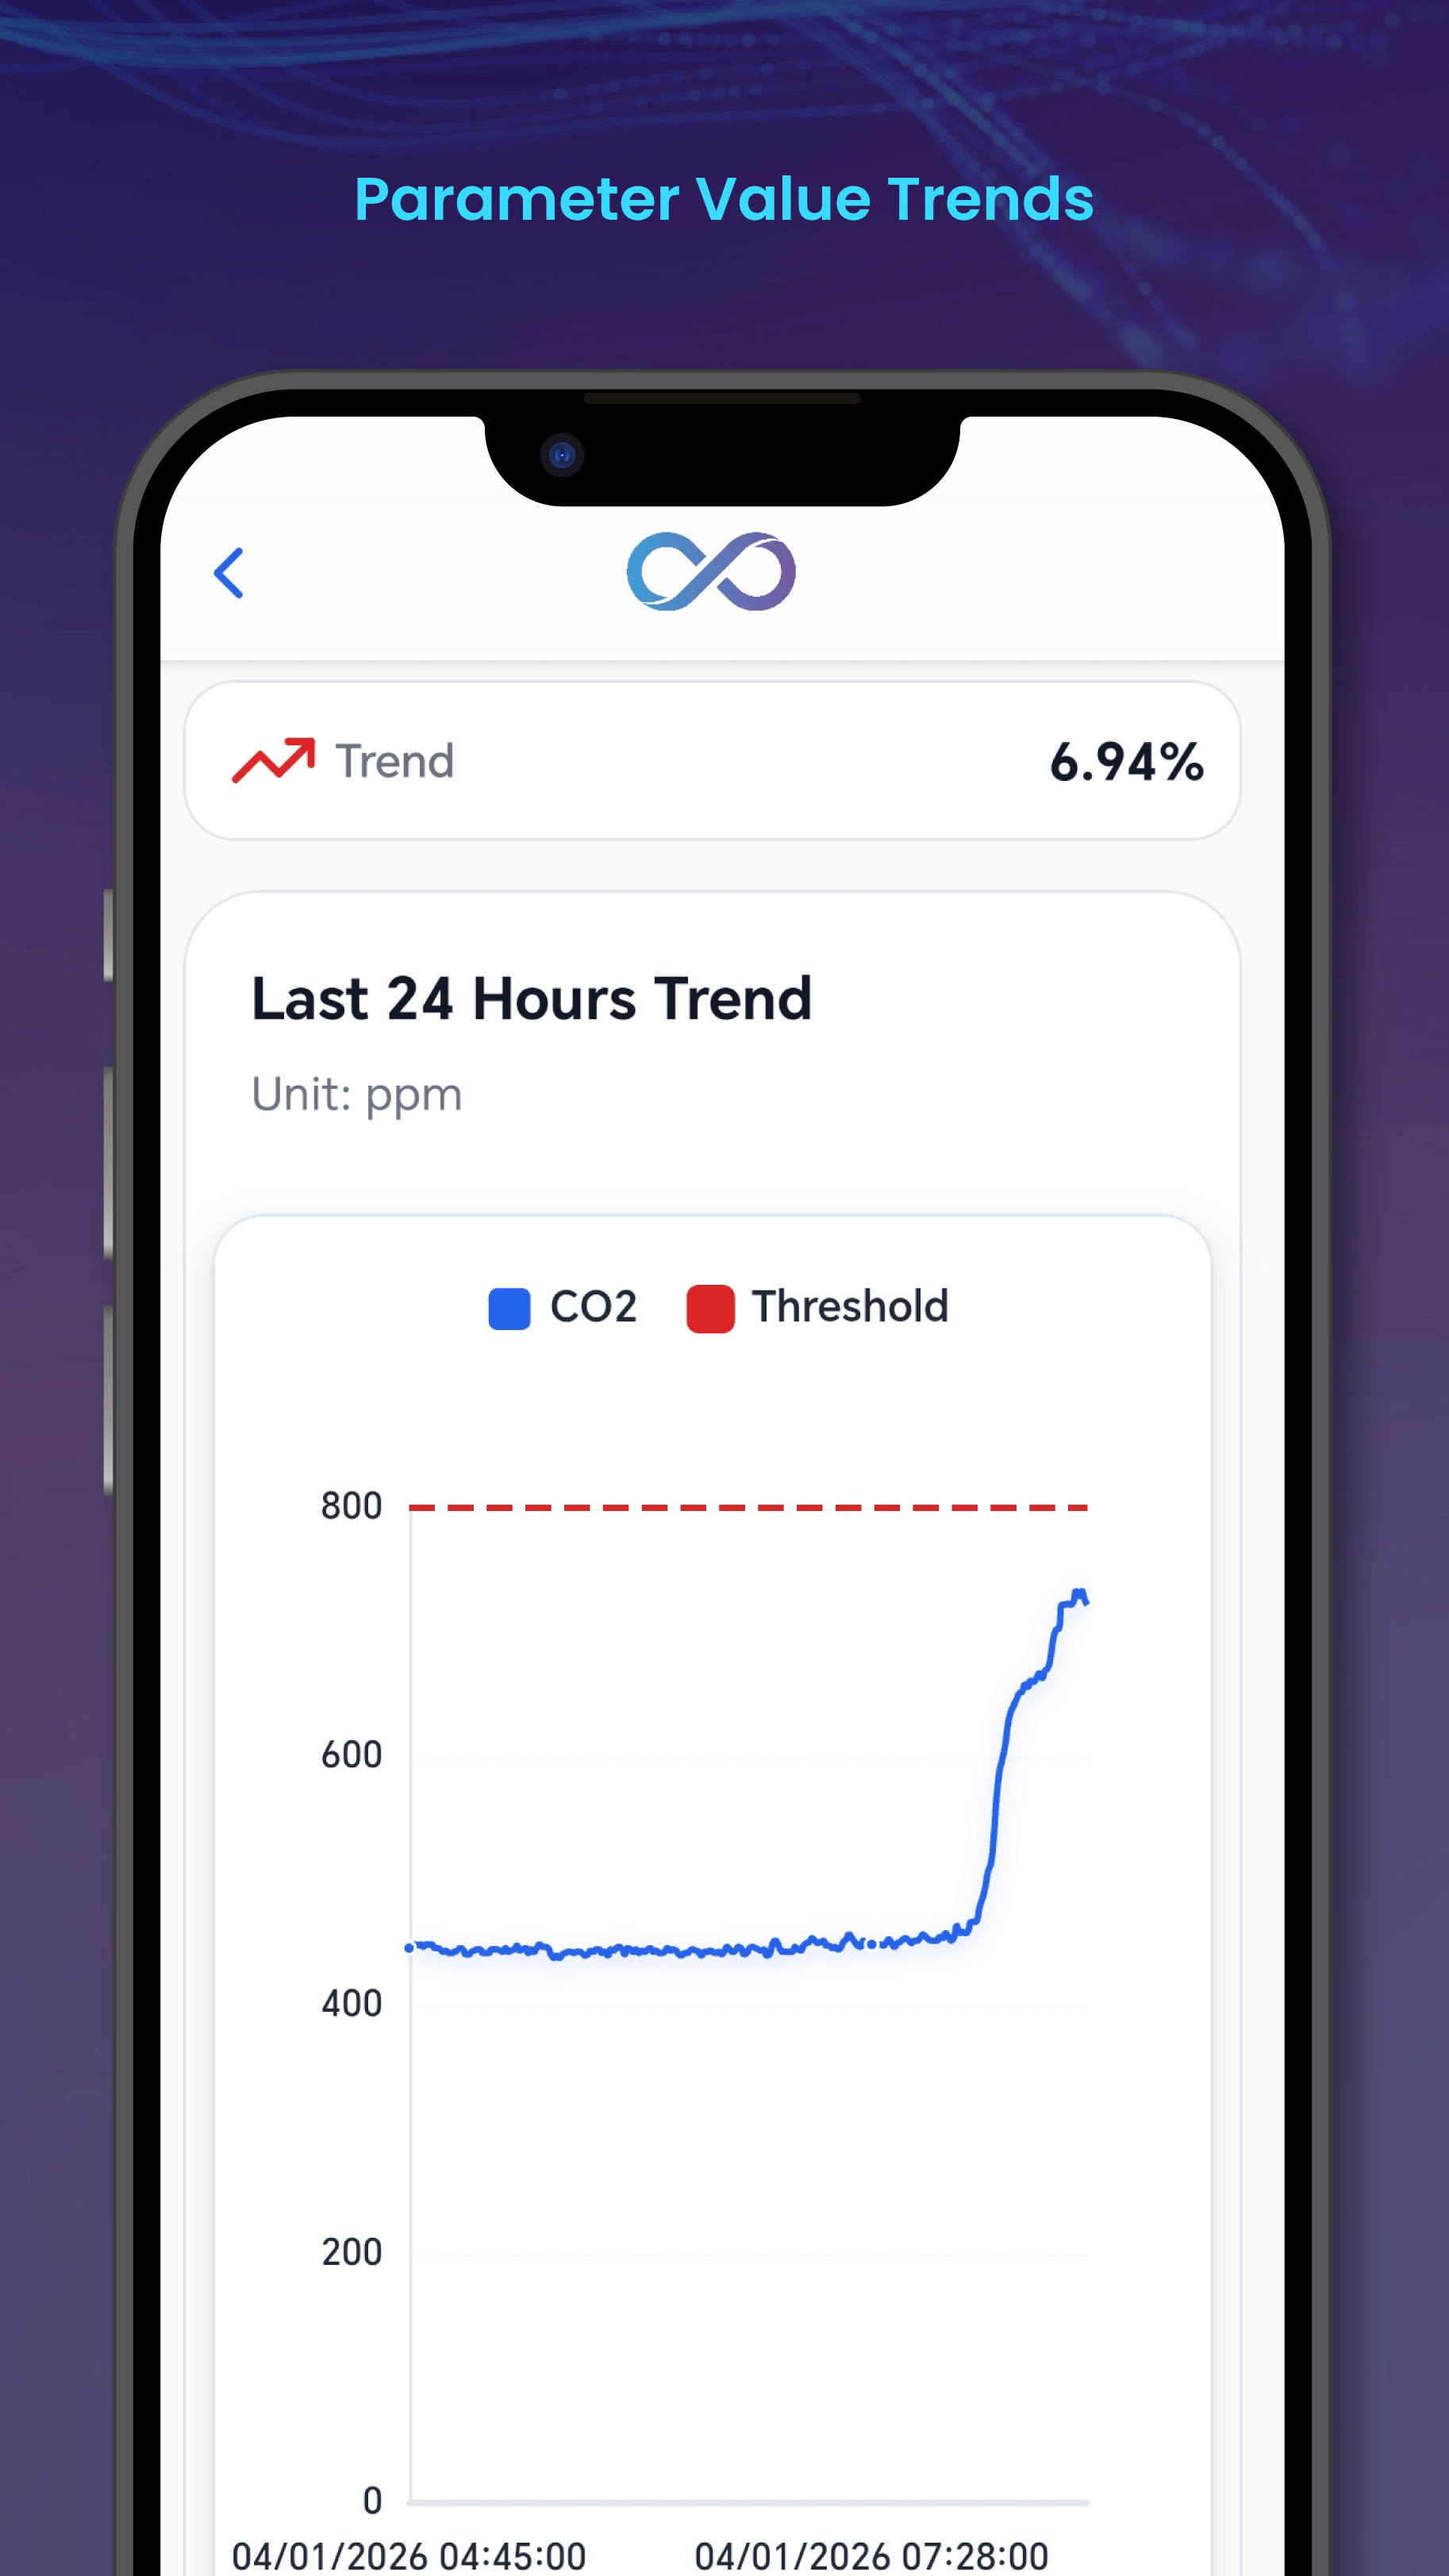
Graph Features:
- Real-time data plotting with 60-second updates
- Multiple time range options (1 hour, 6 hours, 24 hours, 7 days)
- Zoom and pan for detailed analysis
- Hover to view exact values at specific times
Time Range Selection:
- 1 Hour: Detailed short-term monitoring
- 6 Hours: Recent trends and patterns
- 24 Hours: Daily variation analysis
- 7 Days: Weekly performance overview
- Custom Range: Select specific date/time period
Alert Notifications
Receive instant notifications when air quality parameters exceed configured thresholds.
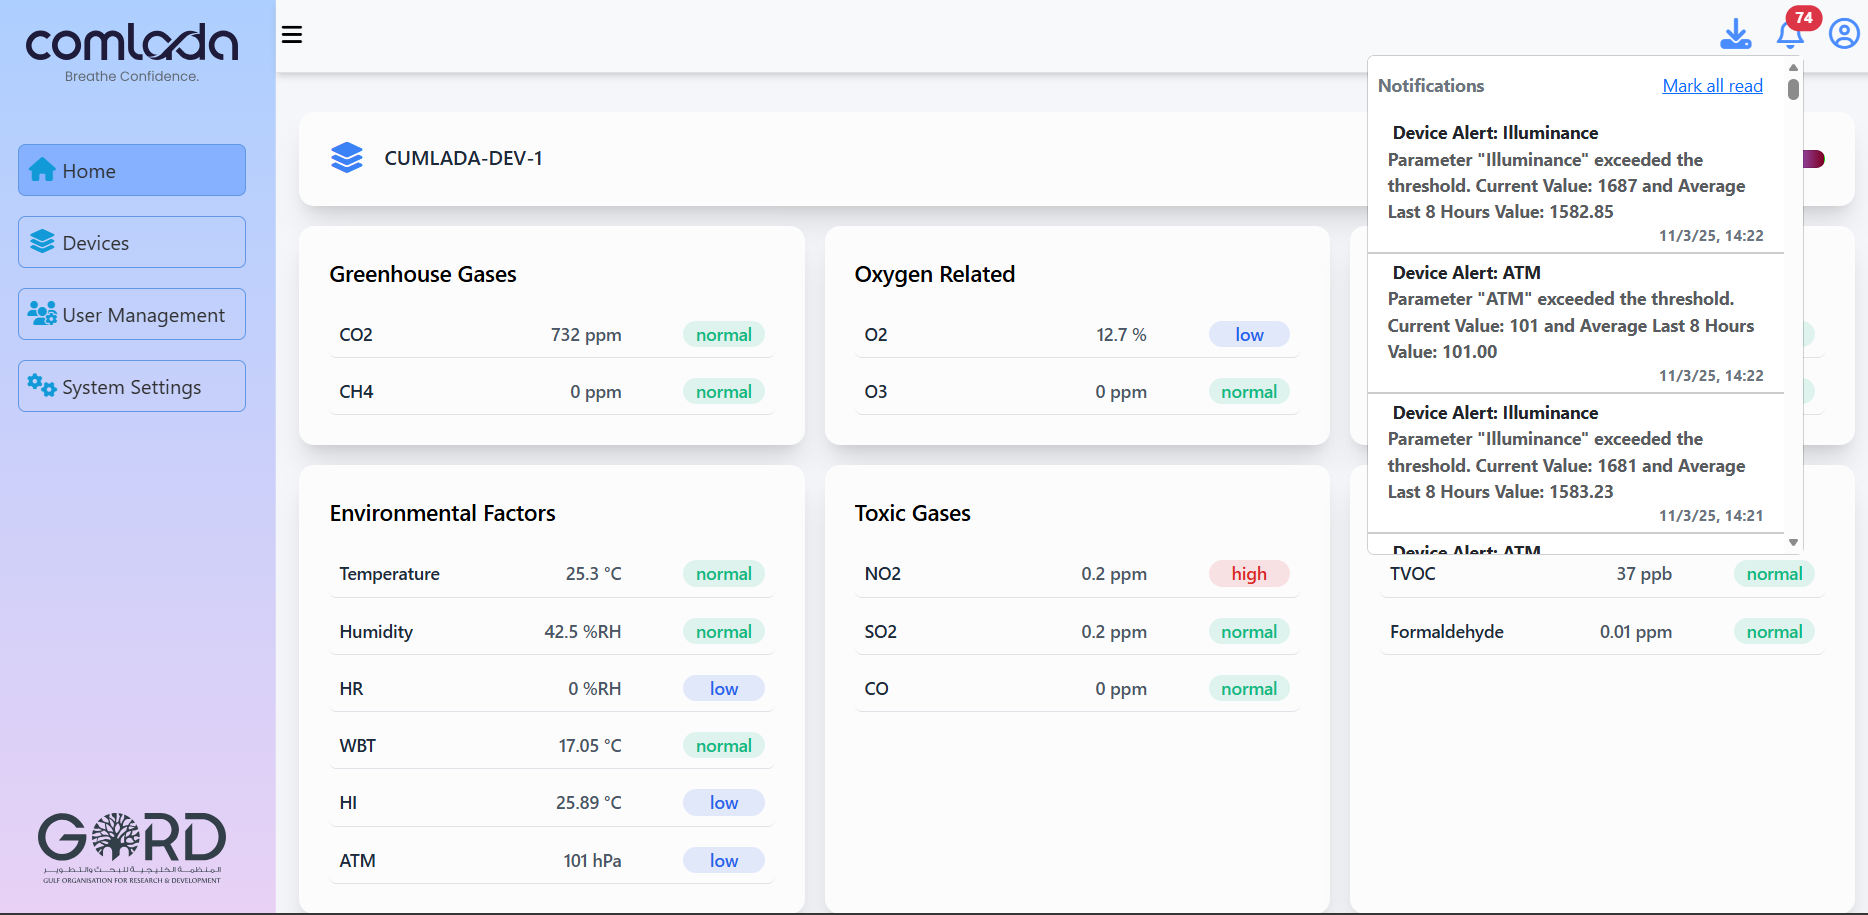
Alert Display:
- Active Alerts: Red banner showing current threshold exceedances
- Alert History: View past alerts and response times
Alert Information Includes:
- Parameter that triggered alert
- Current value vs threshold
- Timestamp of threshold exceedance
Mobile App Dashboard
Access the same monitoring capabilities through the Comlada mobile application with automatic synchronization.
Mobile Features:
- Real-time data access from anywhere
- Push notifications for alerts
- Touch-optimized interface
- Quick device switching
Data Export from Dashboard
Export current readings and recent data directly from the dashboard for analysis.
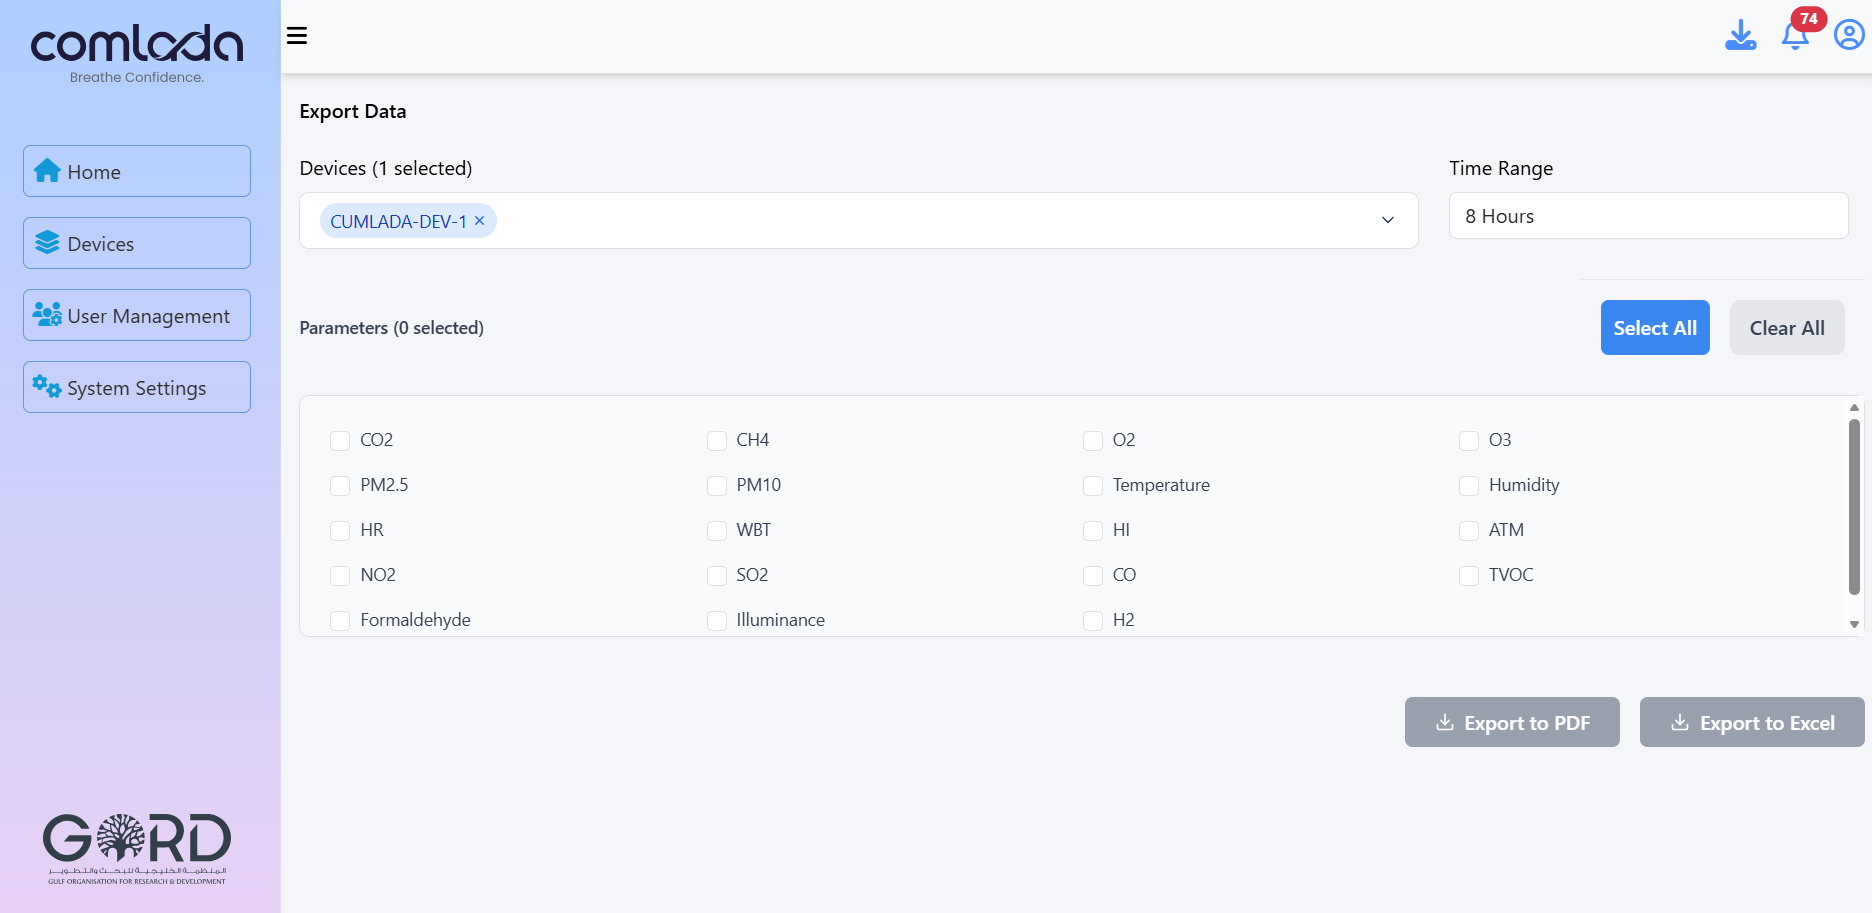
Export Options:
- Select time range for export
- Choose parameters to include
- Click "Export Data To PDF" or Export To Excel
- Download file
Troubleshooting Dashboard Issues
Dashboard Not Loading?
- Check internet connection stability
- Clear browser cache and reload page
- Try different browser or incognito mode
- Verify account login credentials
- Contact support if issue persists
Data Not Updating?
- Confirm device status shows "Online"
- Refresh browser page manually
- Restart mobile app if using mobile device
Cannot See Specific Device?
- Verify device is registered to your account
- Ensure device is powered on and connected
- Contact support: info@gord.qa
Support: info@gord.qa | Response within 24 hours